Starters · 1200 × 630 · 10 layers · 9 variables · data, chart, social
Weekly report with charts
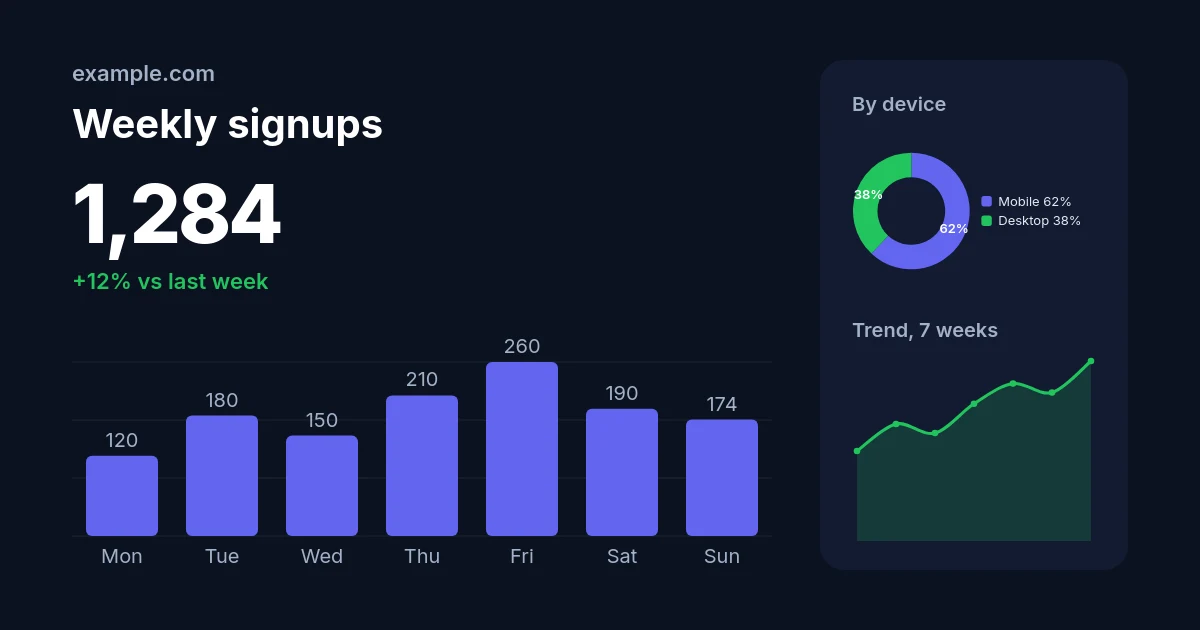
A dark metrics card: a headline number, a bar chart of the week from a comma-separated list of values, a donut of the split and a trend line. Every number is a variable.
rendering…
the same render with your saved copy
curl -X POST https://api.imageapis.com/v1/images \
  -H 'X-API-Key: YOUR_KEY' -H 'Content-Type: application/json' \
  -d '{"template": "tpl_…", "variables": {"site": "example.com", "title": "Weekly signups", "total": "1,284", "change": "+12% vs last week", "values": "120,180,150,210,260,190,174", "labels": "Mon,Tue,Wed,Thu,Fri,Sat,Sun", "split": "62,38", "split_labels": "Mobile,Desktop", "trend": "40,52,48,61,70,66,80"}}'
Make it yours
Copy the starter into your account once; from then on it is a template id you render with new variables. Creating and reading templates is free.
curl -s https://api.imageapis.com/v1/starters/weekly-report -H 'X-API-Key: YOUR_KEY' | jq .template > weekly-report.json
curl -X POST https://api.imageapis.com/v1/templates -H 'X-API-Key: YOUR_KEY' \
  -H 'Content-Type: application/json' -d @weekly-report.json
# → { "id": "tpl_…", "object": "template", … }
Change any layer by name at render time with modifications, or change the design itself in the editor and save it back with PUT /v1/templates/<id>.
Layers
| Name | Type | x, y | Size | Content |
|---|---|---|---|---|
site | text | 72, 60 | 600 × 32 | {{site}} |
title | text | 72, 100 | 700 × 56 | {{title}} |
total | text | 72, 166 | 500 × 96 | {{total}} |
change | text | 72, 268 | 600 × 32 | {{change}} |
bars | chart · bar | 72, 330 | 700 × 240 | {{values}} |
panel | rect | 820, 60 | 308 × 510 | |
split_title | text | 852, 92 | 244 × 30 | By device |
split | chart · donut | 852, 136 | 244 × 150 | {{split}} |
trend_title | text | 852, 318 | 244 × 30 | Trend, 7 weeks |
trend | chart · area | 852, 356 | 244 × 190 | {{trend}} |
The template
Show the JSON (10 layers)
{
  "name": "Weekly report",
  "width": 1200,
  "height": 630,
  "background": "#0b1220",
  "layers": [
    {
      "name": "site",
      "type": "text",
      "x": 72,
      "y": 60,
      "width": 600,
      "height": 32,
      "text": "{{site}}",
      "font": "Inter",
      "weight": 600,
      "size": 22,
      "color": "#a3b1c6"
    },
    {
      "name": "title",
      "type": "text",
      "x": 72,
      "y": 100,
      "width": 700,
      "height": 56,
      "text": "{{title}}",
      "font": "Inter",
      "weight": 700,
      "size": 40,
      "color": "#ffffff",
      "fit": "shrink",
      "max_lines": 1
    },
    {
      "name": "total",
      "type": "text",
      "x": 72,
      "y": 166,
      "width": 500,
      "height": 96,
      "text": "{{total}}",
      "font": "Inter",
      "weight": 800,
      "size": 88,
      "color": "#ffffff",
      "letter_spacing": -3,
      "valign": "middle"
    },
    {
      "name": "change",
      "type": "text",
      "x": 72,
      "y": 268,
      "width": 600,
      "height": 32,
      "text": "{{change}}",
      "font": "Inter",
      "weight": 600,
      "size": 22,
      "color": "#22c55e"
    },
    {
      "name": "bars",
      "type": "chart",
      "kind": "bar",
      "x": 72,
      "y": 330,
      "width": 700,
      "height": 240,
      "values": "{{values}}",
      "labels": "{{labels}}",
      "fill": "#6366f1",
      "track": "rgba(255,255,255,0.08)",
      "label_color": "#a3b1c6",
      "show_values": true,
      "font": "Inter"
    },
    {
      "name": "panel",
      "type": "rect",
      "x": 820,
      "y": 60,
      "width": 308,
      "height": 510,
      "fill": "#121b30",
      "radius": 24
    },
    {
      "name": "split_title",
      "type": "text",
      "x": 852,
      "y": 92,
      "width": 244,
      "height": 30,
      "text": "By device",
      "font": "Inter",
      "weight": 600,
      "size": 20,
      "color": "#a3b1c6"
    },
    {
      "name": "split",
      "type": "chart",
      "kind": "donut",
      "x": 852,
      "y": 136,
      "width": 244,
      "height": 150,
      "values": "{{split}}",
      "labels": "{{split_labels}}",
      "colors": [
        "#6366f1",
        "#22c55e"
      ],
      "show_values": true,
      "label_color": "#e2e8f0",
      "thickness": 0.42,
      "font": "Inter"
    },
    {
      "name": "trend_title",
      "type": "text",
      "x": 852,
      "y": 318,
      "width": 244,
      "height": 30,
      "text": "Trend, 7 weeks",
      "font": "Inter",
      "weight": 600,
      "size": 20,
      "color": "#a3b1c6"
    },
    {
      "name": "trend",
      "type": "chart",
      "kind": "area",
      "x": 852,
      "y": 356,
      "width": 244,
      "height": 190,
      "values": "{{trend}}",
      "fill": "#22c55e",
      "track": "none",
      "smooth": true,
      "line_width": 3,
      "font": "Inter"
    }
  ]
}